Motivating example: uncovering social groups

\(\newcommand{\bmu}{\boldsymbol{\mu}}\) \(\newcommand{\bSigma}{\boldsymbol{\Sigma}}\) \(\newcommand{\bfbeta}{\boldsymbol{\beta}}\) \(\newcommand{\bflambda}{\boldsymbol{\lambda}}\) \(\newcommand{\bgamma}{\boldsymbol{\gamma}}\) \(\newcommand{\bsigma}{{\boldsymbol{\sigma}}}\) \(\newcommand{\bpi}{\boldsymbol{\pi}}\) \(\newcommand{\btheta}{{\boldsymbol{\theta}}}\) \(\newcommand{\bphi}{\boldsymbol{\phi}}\) \(\newcommand{\balpha}{\boldsymbol{\alpha}}\) \(\newcommand{\blambda}{\boldsymbol{\lambda}}\) \(\renewcommand{\P}{\mathbb{P}}\) \(\newcommand{\E}{\mathbb{E}}\) \(\newcommand{\indep}{\perp\!\!\!\perp} \newcommand{\bx}{\mathbf{x}}\) \(\newcommand{\bp}{\mathbf{p}}\) \(\renewcommand{\bx}{\mathbf{x}}\) \(\newcommand{\bX}{\mathbf{X}}\) \(\newcommand{\by}{\mathbf{y}}\) \(\newcommand{\bY}{\mathbf{Y}}\) \(\newcommand{\bz}{\mathbf{z}}\) \(\newcommand{\bZ}{\mathbf{Z}}\) \(\newcommand{\bw}{\mathbf{w}}\) \(\newcommand{\bW}{\mathbf{W}}\) \(\newcommand{\bv}{\mathbf{v}}\) \(\newcommand{\bV}{\mathbf{V}}\) \(\newcommand{\bfg}{\mathbf{g}}\) \(\newcommand{\bfh}{\mathbf{h}}\) \(\newcommand{\horz}{\rule[.5ex]{2.5ex}{0.5pt}}\) \(\renewcommand{\S}{\mathcal{S}}\) \(\newcommand{\X}{\mathcal{X}}\) \(\newcommand{\var}{\mathrm{Var}}\) \(\newcommand{\pa}{\mathrm{pa}}\) \(\newcommand{\Z}{\mathcal{Z}}\) \(\newcommand{\bh}{\mathbf{h}}\) \(\newcommand{\bb}{\mathbf{b}}\) \(\newcommand{\bc}{\mathbf{c}}\) \(\newcommand{\cE}{\mathcal{E}}\) \(\newcommand{\cP}{\mathcal{P}}\) \(\newcommand{\bbeta}{\boldsymbol{\beta}}\) \(\newcommand{\bLambda}{\boldsymbol{\Lambda}}\) \(\newcommand{\cov}{\mathrm{Cov}}\) \(\newcommand{\bfk}{\mathbf{k}}\) \(\newcommand{\idx}[1]{}\) \(\newcommand{\xdi}{}\)

5.1. Motivating example: uncovering social groups#

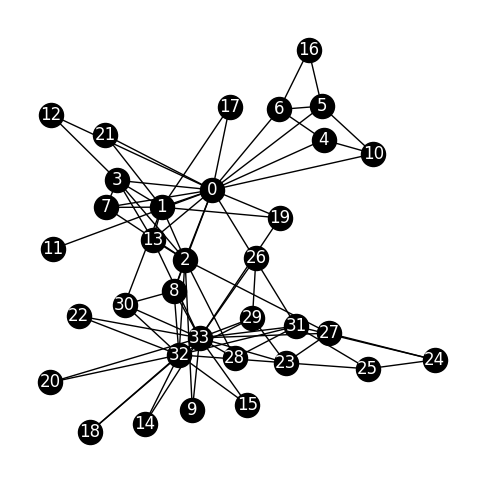
In this chapter, we analyze datasets in the form of networks. As motivation, we first look at the Karate Club dataset.

From Wikipedia:

A social network of a karate club was studied by Wayne W. Zachary for a period of three years from 1970 to 1972. The network captures 34 members of a karate club, documenting links between pairs of members who interacted outside the club. During the study a conflict arose between the administrator “John A” and instructor “Mr. Hi” (pseudonyms), which led to the split of the club into two. Half of the members formed a new club around Mr. Hi; members from the other part found a new instructor or gave up karate. Based on collected data Zachary correctly assigned all but one member of the club to the groups they actually joined after the split.

We use the NetworkX package to load the data and visualize it (with help from Claude, who really likes the number 42.). We will say more about it later in this chapter. In the meantime, there is a good tutorial here.

import networkx as nx
G = nx.karate_club_graph()

plt.figure(figsize=(6,6))
pos = nx.spring_layout(G, k=0.7, iterations=50, seed=42)
nx.draw_networkx(G, pos=pos, node_size=300, node_color='black', font_color='white')
plt.axis('off')
plt.show()
../../_images/32bf74df3d3145966ba04a0397d272dd0f8d18611c5767fe089bfc6ad49f5e0a.png

Our goal:

identify natural sub-groups in the network

That is, we want to find groups of nodes that have many links between them, but relatively few with the other nodes.

It will turn out that the eigenvectors of the Laplacian matrix, a matrix naturally associated to the graph, contain useful information about such communities.

CHAT & LEARN Ask your favority AI chatbot why it likes the number 42 so much. \(\ddagger\)